ERNE/HED anisotropy measurements
![[Chart of ERNE visualization method]](images/ernechart.jpg)
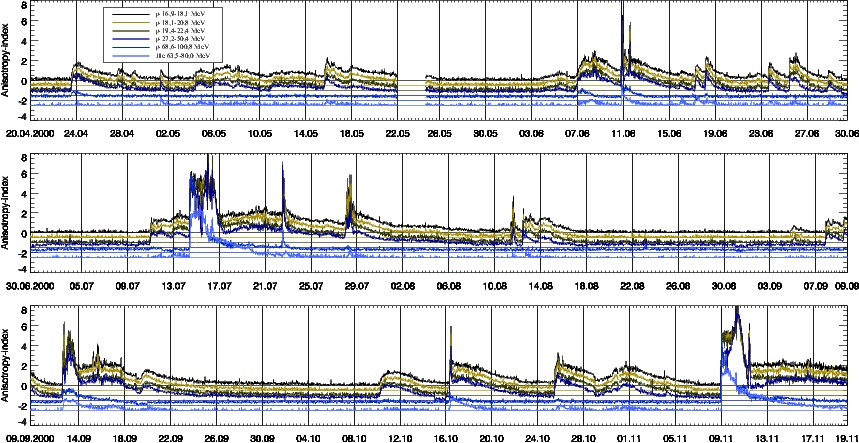
Anisotropy index map:
The anisotropy index is an arbitrary indicator of anisotropy in the measurements. It is derived from the measurements by calculating the difference between the highest intensity values and the lowest ones and dividing their difference by their errors in order to have a statistically interpretable value. Values of over two correspond to measurements with very high probability of having statistically significant (> 2 sigmas ) anisotropy in them.Below is an anisotropy map from the above mentioned time period. The anisotropy index is shown for all the six energy channels for which anisotropy measurements are made, although only the measurements from the first three combined are viewable in the form of animation below. You may click on portions of the graph to jump to the corresponding entry. When anisotropy index peaks aren't linked to an entry, sufficient anisotropy data wasn't available for meaningful visualization.
List of events animated:
- Event of 09.11.2000 (added 22.06.2005)
- Event of 31.10.2000 (added 22.06.2005)
- Event of 25.10.2000 (added 22.06.2005)
- Event of 16.10.2000 (added 22.06.2005)
- Event of 15.09.2000 (added 22.06.2005)
- Event of 12.09.2000 (added 20.06.2005)
- Event of 11.08.2000 (added 20.06.2005)
- Event of 27.07.2000 (added 20.06.2005)
- Event of 22.07.2000 (added 20.06.2005)
- Event of 14.07.2000 (added 20.06.2005)
- Event of 25.06.2000 (added 20.06.2005)
- Event of 17.06.2000 (added 20.06.2005)
- Event of 10.06.2000 (added 20.06.2005)
- Event of 07.06.2000 (added 20.06.2005)
- Event of 15.05.2000 (added 20.06.2005)
In addition, the following events outside the designated time period have also been made available:
Event of 09.11.2000 (added 22.06.2005)![[image]](images/event_00_11_09_yparm.jpg) Anisotropy index values for event |
![[image]](images/event_00_11_09_flux.gif) Measured total flux of event |
![[image]](images/event_00_11_09_tn.jpg) Animation of anisotropy measurements (2.1 MB .avi, msmpeg4v2 format) | |
Event of 31.10.2000 (added 22.06.2005)![[image]](images/event_00_10_31_yparm.jpg) Anisotropy index values for event |
![[image]](images/event_00_10_31_flux.gif) Measured total flux of event |
![[image]](images/event_00_10_31_tn.jpg) Animation of anisotropy measurements (1.2 MB .avi, msmpeg4v2 format) | |
Event of 25.10.2000 (added 22.06.2005)![[image]](images/event_00_10_25_yparm.jpg) Anisotropy index values for event |
![[image]](images/event_00_10_25_flux.gif) Measured total flux of event |
![[image]](images/event_00_10_25_tn.jpg) Animation of anisotropy measurements (2.1 MB .avi, msmpeg4v2 format) | |
Event of 16.10.2000 (added 22.06.2005)![[image]](images/event_00_10_16_yparm.jpg) Anisotropy index values for event |
![[image]](images/event_00_10_16_flux.gif) Measured total flux of event |
![[image]](images/event_00_10_16_tn.jpg) Animation of anisotropy measurements (1.7 MB .avi, msmpeg4v2 format) | |
Event of 15.09.2000 (added 22.06.2005)![[image]](images/event_00_09_15_yparm.jpg) Anisotropy index values for event |
![[image]](images/event_00_09_15_flux.gif) Measured total flux of event |
![[image]](images/event_00_09_15_tn.jpg) Animation of anisotropy measurements (1.7 MB .avi, msmpeg4v2 format) | |
Event of 12.09.2000 (added 20.06.2005)![[image]](images/event_00_09_12_yparm.jpg) Anisotropy index values for event |
![[image]](images/event_00_09_12_flux.gif) Measured total flux of event |
![[image]](images/event_00_09_12_tn.jpg) Animation of anisotropy measurements (2.1 MB .avi, msmpeg4v2 format) | |
Event of 11.08.2000 (added 20.06.2005)![[image]](images/event_00_08_11_yparm.jpg) Anisotropy index values for event |
![[image]](images/event_00_08_11_flux.gif) Measured total flux of event |
![[image]](images/event_00_08_11_1_tn.jpg) Animation of anisotropy measurements (1.4 MB .avi, msmpeg4v2 format) |
![[image]](images/event_00_08_11_2_tn.jpg) Animation of second phase (1.0 MB .avi, msmpeg4v2 format) |
Event of 27.07.2000 (added 20.06.2005)![[image]](images/event_00_07_27_yparm.jpg) Anisotropy index values for event |
![[image]](images/event_00_07_27_flux.gif) Measured total flux of event |
![[image]](images/event_00_07_27_tn.jpg) Animation of anisotropy measurements (4.4 MB .avi, msmpeg4v2 format) | |
Event of 22.07.2000 (added 20.06.2005)![[image]](images/event_00_07_22_yparm.jpg) Anisotropy index values for event |
![[image]](images/event_00_07_22_flux.gif) Measured total flux of event |
![[image]](images/event_00_07_22_tn.jpg) Animation of anisotropy measurements (2.1 MB .avi, msmpeg4v2 format) | |
Event of 14.07.2000 (added 20.06.2005)![[image]](images/event_00_07_14_yparm.jpg) Anisotropy index values for event |
![[image]](images/event_00_07_14_flux.gif) Measured total flux of event |
![[image]](images/event_00_07_14_tn.jpg) Animation of anisotropy measurements (5.6 MB .avi, msmpeg4v2 format) | |
Event of 25.06.2000 (added 20.06.2005)![[image]](images/event_00_06_25_yparm.jpg) Anisotropy index values for event |
![[image]](images/event_00_06_25_flux.gif) Measured total flux of event |
![[image]](images/event_00_06_25_tn.jpg) Animation of anisotropy measurements (1.4 MB .avi, msmpeg4v2 format) | |
Event of 17.06.2000 (added 20.06.2005)![[image]](images/event_00_06_17_yparm.jpg) Anisotropy index values for event |
![[image]](images/event_00_06_17_flux.gif) Measured total flux of event |
![[image]](images/event_00_06_17_tn.jpg) Animation of anisotropy measurements (1.7 MB .avi, msmpeg4v2 format) | |
Event of 10.06.2000 (added 20.06.2005)![[image]](images/event_00_06_10_yparm.jpg) Anisotropy index values for event |
![[image]](images/event_00_06_10_flux.gif) Measured total flux of event |
![[image]](images/event_00_06_10_tn.jpg) Animation of anisotropy measurements (1.3 MB .avi, msmpeg4v2 format) | |
Event of 07.06.2000 (added 20.06.2005)![[image]](images/event_00_06_07_yparm.jpg) Anisotropy index values for event |
![[image]](images/event_00_06_07_flux.gif) Measured total flux of event |
![[image]](images/event_00_06_07_tn.jpg) Animation of anisotropy measurements (1.2 MB .avi, msmpeg4v2 format) | |
Event of 15.05.2000 (added 20.06.2005)![[image]](images/event_00_05_15_yparm.jpg) Anisotropy index values for event |
![[image]](images/event_00_05_15_flux.gif) Measured total flux of event |
![[image]](images/event_00_05_15_tn.jpg) Animation of anisotropy measurements (1.0 MB .avi, msmpeg4v2 format) | |
|
Event of 02.05.1998 (added 24.05.2005) (No Anisotropy index graph available) |
![[image]](images/event_98_05_02_flux.gif) Measured total flux of event |
![[image]](images/event_98_05_02_tn.jpg) Animation of anisotropy measurements (2.8 MB .avi, msmpeg4v2 format) | |
|
Event of 15.01.2005 (added 20.06.2005, modified 21.3.2006) (No Anisotropy index graph available) |
![[image]](images/event_05_01_15_flux.gif) Measured total flux of event |
![[image]](images/event_05_01_15_1_tn.jpg) Animation of anisotropy measurements (2.1 MB .avi, msmpeg4v2 format) |
![[image]](images/event_05_01_15_2_tn.jpg) Animation of second phase (1.7 MB .avi, msmpeg4v2 format) |
University of Turku, Space Research Laboratory, 2005-2023